Step-by-step guide to integrating Kommo and Google Data Studio.
Integrating Kommo and Google Data Studio is a great way to improve your data analysis and information visualization, which in turn will help you make more informed business decisions. If you already use Kommo (formerly known as amoCRM) to manage your customers and sales, adding Google Data Studio to your work environment can greatly improve your team’s efficiency. Let’s break it down step by step.
The first thing you need to do is make sure you have access to both tools. If you don’t have a Google Data Studio account yet, just head over to the site and create an account. It only takes a few minutes. After that, make sure you have an active account in Kommo. If you’re already using that platform, you’re on the right track.
Now that you have access to both services, the next step is to create a connection between them. To do this, you will need to use the Kommo API. Don’t be alarmed if you are not familiar with programming – it is actually quite simple. You will need to get the API key from your Kommo account. To do this, go to your account settings and find the API section. Copy the key, you will need it.
Once you have received your API key, open Google Data Studio and create a new report. In this report, you will be able to add different data sources. To integrate with Kommo, you will need to select the "Create a data source" option and then select "Connect to API". Here you will be asked to enter your API key that you copied earlier. Enter it and click "Connect".
Now that you're connected to Kommo, you can choose what data you want to import into Google Data Studio. This could be information about customers, deals, tasks, and more. Select the fields you want and click "Add to report." This will allow you to visualize the data in a format that's convenient for you.
Once the data is loaded, you can start creating your visualizations. Google Data Studio offers a variety of tools for creating graphs, tables, and charts. You can customize them to display exactly the information you need. For example, you can create a graph showing sales dynamics over a certain period, or a table with information about your most active customers.
Don't forget that Google Data Studio lets you share reports with your team. This is very convenient, as everyone will be able to see up-to-date data and make decisions based on a single piece of information. You can set up access for different users so that everyone can see only the information they need.
Examples of data visualization from Kommo in Google Data Studio.
The integration of Kommo and Google Data Studio opens up a wealth of data visualization options for users. If you already use Kommo to manage your customers and sales, you probably understand how important it is to have access to analytics that help you make informed decisions. In this context, Google Data Studio becomes a great tool to transform your data into visual and understandable reports.
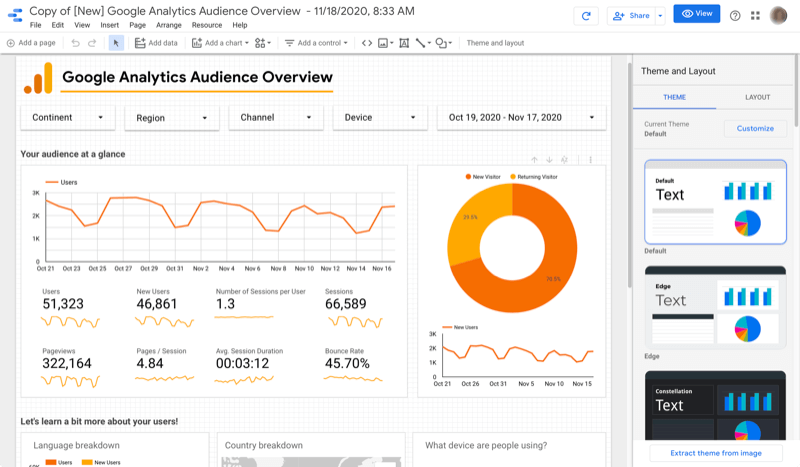
To begin with, the integration of these two platforms allows you to extract data from Kommo and present it in the form of interactive dashboards. This is especially useful when you need to track key performance indicators, such as the number of deals, conversion rates in the sales funnel, or the activity of your managers. For example, you can create a dashboard that shows how many deals were closed in a certain period and how this relates to your goals. This not only helps you see the big picture, but also allows you to quickly react to changes.
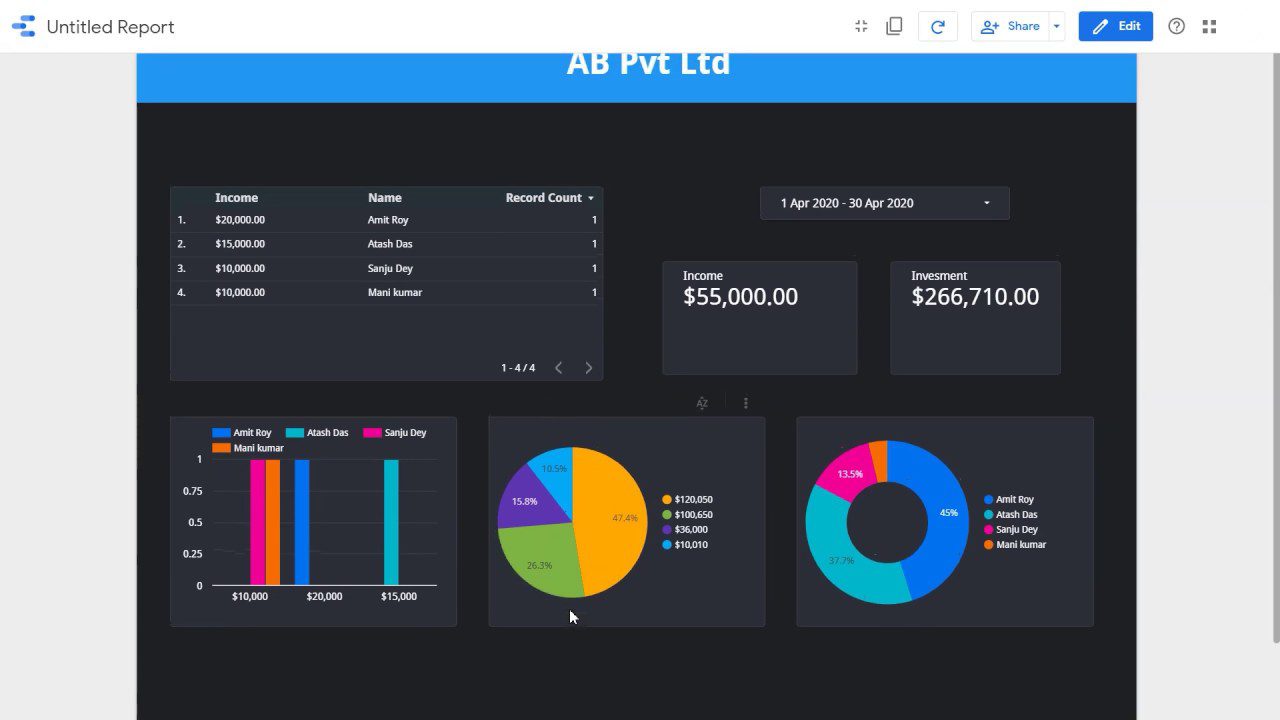
Next, it is worth noting that data visualization in Google Data Studio allows you to use various charts and diagrams, which makes the information more accessible to perception. You can use pie charts to display market shares, line charts to analyze sales dynamics, or bar charts to compare the results of different teams. All this helps not only you but also your colleagues to better understand how things are going in the company.
Additionally, the integration of Kommo and Google Data Studio allows you to customize reports to your needs. You can choose what data you want to see and how it will be presented. For example, if you want to analyze the effectiveness of advertising campaigns, you can create a separate report that will show which channels bring in the most customers and which ones require improvement. This gives you the opportunity not only to track current results, but also to plan future actions.
Don’t forget that Google Data Studio allows you to share reports with colleagues. This means that you can easily show the results of your work, share insights, and receive feedback. You can set up access for different users, which makes the process of collaboration more convenient and efficient. This way, each team member can access relevant information at any time and make decisions based on data.
Benefits of using Kommo and Google Data Studio integration.
One of the main advantages of the integration is the ability to create visual reports. With Google Data Studio, you can easily transform raw data from Kommo into beautiful and informative graphs and charts. This not only simplifies the perception of information, but also allows you to quickly identify key trends and patterns. For example, you can see which products are in the greatest demand, or analyze at what time of day your sales reach their peak. Thus, data visualization helps not only in analysis, but also in planning future strategies.
In addition, the integration allows you to automate the data update process. You no longer need to manually collect information from Kommo and upload it to Google Data Studio. All updates are automatic, which saves you time and reduces the likelihood of errors. This is especially important for companies that work with large amounts of data and need up-to-date information to make prompt decisions. Now you can focus on more important tasks, knowing that your reports will always be up-to-date.
Another significant benefit is the ability to collaborate. Google Data Studio makes it easy to share reports with colleagues and partners. You can share your reports so that other team members can make changes or add comments. This creates a more transparent working environment and promotes better communication within the team. As a result, you can react to changes faster and make more informed decisions.
It’s also worth remembering that the integration of Kommo and Google Data Studio helps you better understand your customers. With detailed reports, you can analyze your customers’ behavior, preferences, and needs in more depth. This, in turn, will allow you to tailor your offers and improve the quality of your service. The better you understand your customers, the more likely they are to stay with you for a long time.
Frequently asked questions about the Kommo and Google Data Studio integration
One of the most common questions is how often the data in Google Data Studio is refreshed. Usually, the data is refreshed automatically, but you can customize the refresh frequency based on your needs. This allows you to always have up-to-date information at your fingertips.
Another question that often comes up is about data security. Many users are concerned about how their data will be protected when integrated. It is important to note that both Kommo and Google Data Studio take serious measures to ensure data security. By using the API, you can be sure that your data is transferred safely and protected from unauthorized access.
It is also worth mentioning that if you have any difficulties with the integration, you can always contact our agency. We at Exceltic are ready to help you at every stage of the process and answer any questions that may arise. Do not hesitate to ask questions, as this will help you understand the integration faster and start benefiting from data analysis.