Steps to integrate Kommo and Power BI
Integrating Kommo and Power Bi is a great way to improve your data analysis and increase your team’s efficiency. If you already use Kommo (formerly known as amoCRM) for customer relationship management, adding Power BI to your ecosystem can make data visualization and analysis much easier. Let’s take a look at the basic steps to integrate these two powerful tools.
The first step to integration is to understand what you want to achieve. Ask yourself: what data from Kommo do you need in Power BI? This could be sales data, customer interactions, or even statistics on the effectiveness of marketing campaigns. Once you have defined your goals, you can fine-tune the integration and get exactly the information you need.
Once you have defined your goals, the next step is to set up the API. Kommo provides an API that allows you to extract data from your CRM system. To do this, you will need to create an API key in the Kommo settings. It is a fairly simple process: go to the Settings section, find the API item, and follow the instructions. Remember to save your key, as you will need it to connect to Power BI.
Now that you have your API key, it’s time to head over to Power BI. Open Power BI Desktop and select the Get Data option. You’ll find a variety of data sources in this menu, but you’ll want to select Web. Here, you’ll be able to enter the Kommo API URL that will be used to retrieve the data. It’s important to remember that you’ll also need to provide the headers, including your API key, so that Power BI can access the data.
Once you have set up the connection, Power BI will start pulling data from Kommo. At this point, you can see a preview of the data and choose exactly which tables and fields you need. This is very convenient, as you can filter out unnecessary data and leave only what is really important for your analysis. Once you have selected the data you need, click “Load” and it will appear in your Power BI.
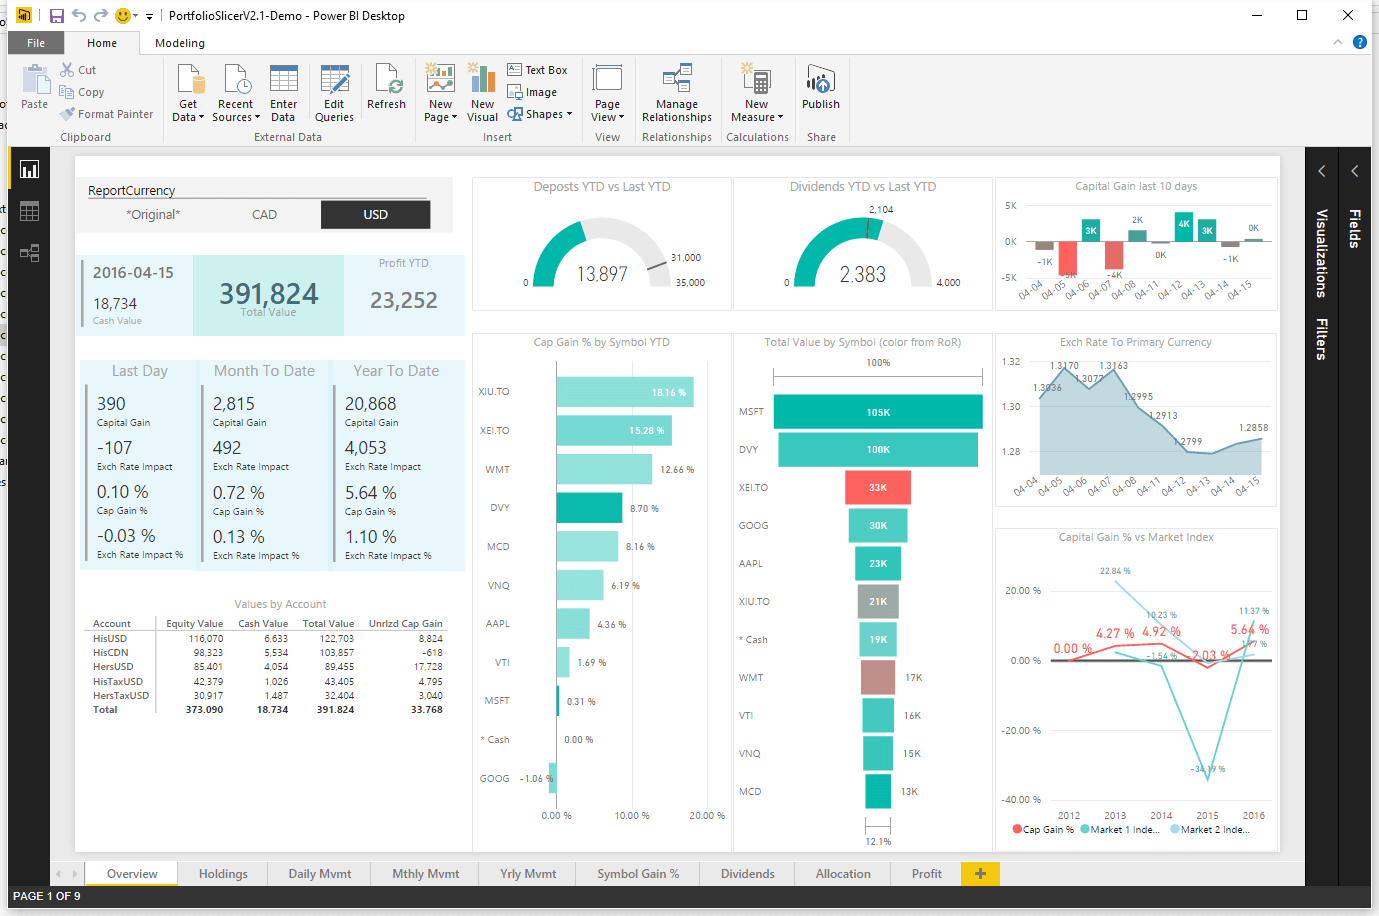
Now that your data is loaded, you can start visualizing it. Power BI offers a variety of tools for creating reports and dashboards. You can use graphs, charts, and tables to present your data in the format that’s most useful to you. This will allow you to not only analyze your current metrics, but also identify trends and patterns that can help you make more informed business decisions.
Keep in mind that integrating Kommo and Power BI is not a one-time process. You will need to refresh your data periodically to keep it current. Power BI allows you to set up automatic data refresh, which will make your work much easier. You can set a refresh schedule to ensure that your data is always fresh and relevant.
Benefits of Using Power BI with Kommo
Kommo provides rich customer engagement data, and Power BI lets you turn that data into visual graphs and charts. Not only does this make the information easier to digest, but it also helps you quickly spot trends and patterns. For example, you can easily track which products are most popular with your customers, and make informed decisions about inventory or marketing strategies based on that.
Additionally, Kommo’s integration with Power BI allows you to automate your reporting process. Instead of spending hours manually collecting data and creating reports, you can set up automatic data refresh in Power BI. This means you’ll always have access to up-to-date information, allowing you to focus on more important tasks like developing strategies and engaging with customers. Automating your reporting not only saves time, but also reduces the likelihood of errors that can occur when manually entering data.
Another important aspect is the ability to analyze data in depth. Power BI offers powerful analysis tools such as DAX (Data Analysis Expressions), which allow you to create complex calculations and data models. This means that you can not only look at the data, but also analyze it, revealing hidden connections and dependencies. For example, you can analyze how different factors, such as the season or marketing campaigns, affect sales. This will help you better understand customer behavior and adapt your strategies.
It’s also worth remembering that Kommo’s integration with Power BI helps improve teamwork. With Power BI, you can share reports and dashboards with colleagues, allowing everyone on the team to be on the same page. This is especially important in a remote work environment where employees may be located in different parts of the world. The ability to share data and reports helps improve communication and speed up decision-making.
Finally, it is worth noting that the integration of Kommo and Power BI does not require deep technical knowledge. There are ready-made solutions and instructions that will help you quickly set up the integration and start using all the benefits of these platforms. This makes the process accessible to any user, regardless of their level of training.
Examples of data visualization from Kommo in Power BI
The integration of Kommo and Power BI opens up a wealth of opportunities for users to visualize data and analyze business processes. If you are already familiar with Kommo, you know how important it is to have access to up-to-date information about customers and sales. Now imagine how you can improve this process by using Power BI to create visual reports and dashboards. This will not only make it easier to analyze data, but also help you make more informed decisions.
To begin with, the integration of these two platforms allows you to extract data from Kommo and visualize it in Power BI. For example, you can create a report that shows sales dynamics over a certain period. This can be especially useful for tracking the performance of your team. With Power BI, you can easily set up graphs and charts that clearly show how sales change over time, allowing you to quickly identify trends and anomalies.
Additionally, you can use Power BI to analyze your customer base. For example, you can create a visualization that shows the distribution of customers across different segments. This will help you understand which customer groups are most profitable and which require additional attention. By comparing data from Kommo with other sources, you can gain a more complete picture of your audience and adapt your marketing strategies accordingly.
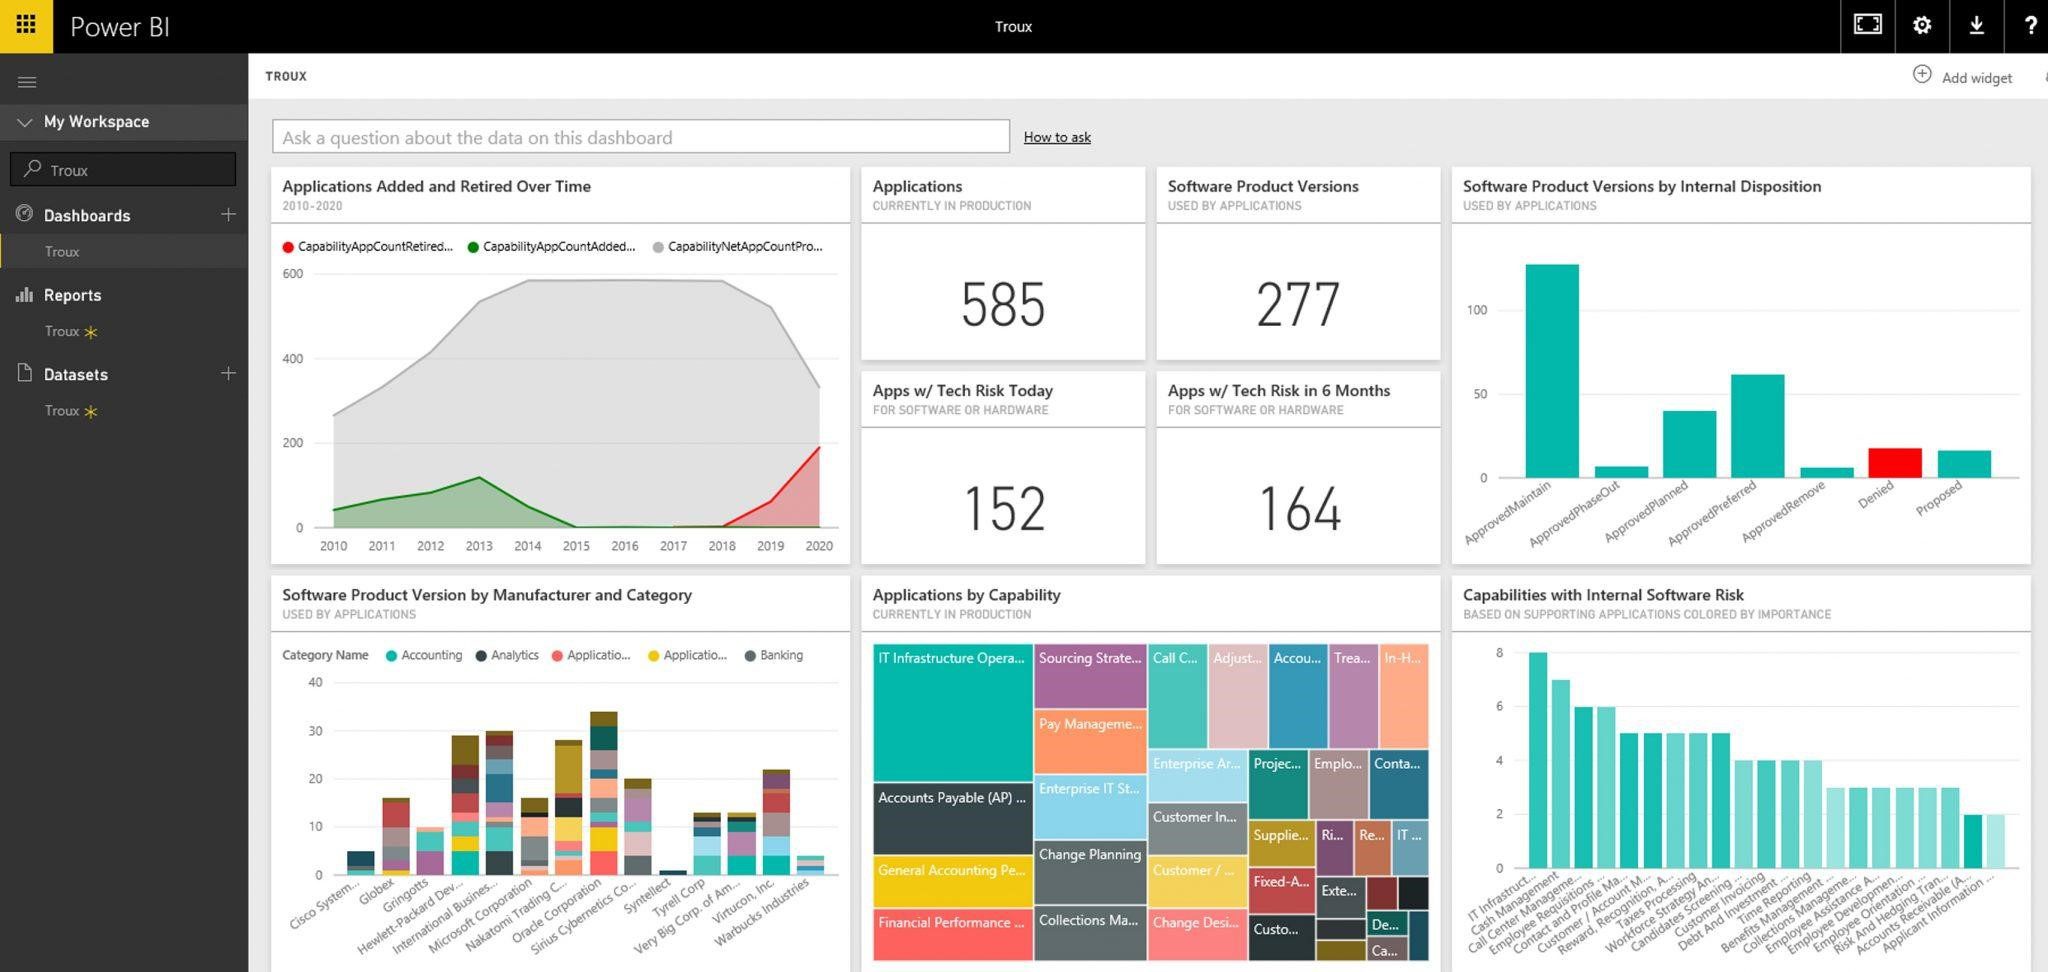
Don’t forget about the ability to create dashboards that combine multiple visualizations. This allows you to see the whole picture at once. For example, you can create a dashboard that includes data on sales, customer activity, and marketing campaign performance. This approach not only simplifies analysis, but also makes it more interactive. You can customize filters and parameters to focus on the aspects that interest you at the moment.
Another interesting example of data visualization from Kommo to Power BI is creating reports on employee performance. You can track how many deals each manager closed in a certain period and compare the results with each other. This will not only help you identify the best employees, but also give you an opportunity to understand which work methods bring the best results. Visualizing such data in the form of bar charts or graphs makes the information more accessible and understandable. You can then focus on analyzing the data, rather than collecting it. This significantly saves time and resources, allowing you to focus more on strategic planning and business development.
In conclusion, the integration of Kommo and Power BI opens up new horizons for data analysis and visualization. Using these tools, you will be able to not only improve your understanding of your business processes, but also increase the efficiency of your entire team. So, don’t miss the opportunity to take advantage of all the benefits this integration provides and start creating your own visualizations today!